Tricks to Improve your Random Forests
Inspiration: Jeremy Howard fastai Course
Whether you need to classify an object or predict a continues outcome or even a cluster unsupervised data Random Forests offers you a base line model to test your results sometimes even a better one than the most popular algorithm.
With some of the perks including:
- Parallelization
- Robustness
- Easy to Understand
- No need to assume anything about the data.
- Doesn’t overfit usually.
- Gives estimate of important varibales.
- No need for cross validation.
“Come to woods, for here is the rest” - John Muir
Algorithms such as XGBoost Random Forests helped many to land top on the winner boards in many machine learning competitions.
Forest is nothing but a piece of land with many trees, which is same as a rondom forest which is nothing but a combination of many desicion trees. A slight analogy of differences between a crop and a forest can used to describe a good random forest model, i.e a good random forest is defined as the one with multiple trees which has less correlation between them.
Here is the original paper on Random Forests
You have fitted your data and claluclated the R^2 score of your model and got 0.75 what to do next to increase it to 0.98
Let’s write some helper functions that are useful in the process All the values you see below is for iris dataset
1
2
3
4
5
6
7
8
9
10
11
12
13
14
15
16
17
18
19
20
21
22
23
24
25
26
27
28
29
30
# Import Libraries
from fastai.imports import *
from fastai.structured import *
from IPython.display import display
from sklearn import metrics

# Load Dataset
from sklearn import datasets
iris = datasets.load_iris()
X = iris.data
y = iris.target

# Split Data
from sklearn.model_selection import train_test_split
x_train,x_test,y_train,y_test = train_test_split(X,y,test_size = 0.2, stratify = y)

# Load Model
from sklearn.ensemble import RandomForestClassifier

# Metrics Functions
def rmse(x,y): return math.sqrt(((x-y)**2).mean())

def print_score(m):
  """
  Returns: rmse of train, rmse of test, r^2 of train, r^2 of test and oob_score(if given)
  """
    res = [rmse(m.predict(x_train), y_train), rmse(m.predict(x_test), y_test),
                m.score(x_train, y_train), m.score(x_test, y_test)]
    if hasattr(m, 'oob_score_'): res.append(m.oob_score_)
    print(res)
Tip 1: Grow all the trees at the same time:
Random Forest models are very fast to train because of their parallelization across all the avaiable cores either in your CPU using
n_jobs.
1
2
3
4
5
6
# parallelize your Model
rf_clf = RandomForestClassifier(n_jobs = -1)

n_jobs = -1 # Uses all the cores of your CPU
n_jobs = 1 # Uses 1 core in your cpu
n_jobs = 2 # Uses 2 cores in your cpu etc.
Tip 2: Divide the tree into groups to help them grow fast:
Random forests works perfectly even if you have billions of rows if you have enough resource and processing power OR you can break down data into subsets - SUB SAMPLING
1
2
3
4
5
6
7
# If you are using fastai library split_vals can be used to split data into subsets
size = int # required size
X_train, _ = split_vals(df_trn, size)
y_train, _ = split_vals(y_trn, size)

# set model samples
set_rf_samples(size)
You can also Bootstrap parameter to choose the samples from data
True : Draws a subset sample size from the data with replacement
False : Let’s you sample whole data for every tree while you the randomizes the columns that goes to the tree.
Tip 3: Always use optimal number of trees for a better Forest:
Play with numbers of tree (n_estimators) until you get a good model or use Grid Search to find optimal parameters
1
2
3
4
5
6
7
8
9
10
11
12
13
14
m = RandomForestClassifier(n_estimators=10, n_jobs=-1)
m.fit(x_train, y_train)
print_score(m)
# [0.09128709291752768, 0.18257418583505536, 0.9916666666666667, 0.9666666666666667]

m = RandomForestClassifier(n_estimators=20, n_jobs=-1)
m.fit(x_train, y_train)
print_score(m)
# [0.12909944487358055, 0.18257418583505536, 0.9833333333333333, 0.9666666666666667]

m = RandomForestClassifier(n_estimators=40, n_jobs=-1)
m.fit(x_train, y_train)
print_score(m)
# [0.0, 0.18257418583505536, 1.0, 0.9666666666666667]
Bagging : Combination of weak trees makes a forest a better classifier.
Plot the graph of tree vs score to get a better idea to select the number of estimators:
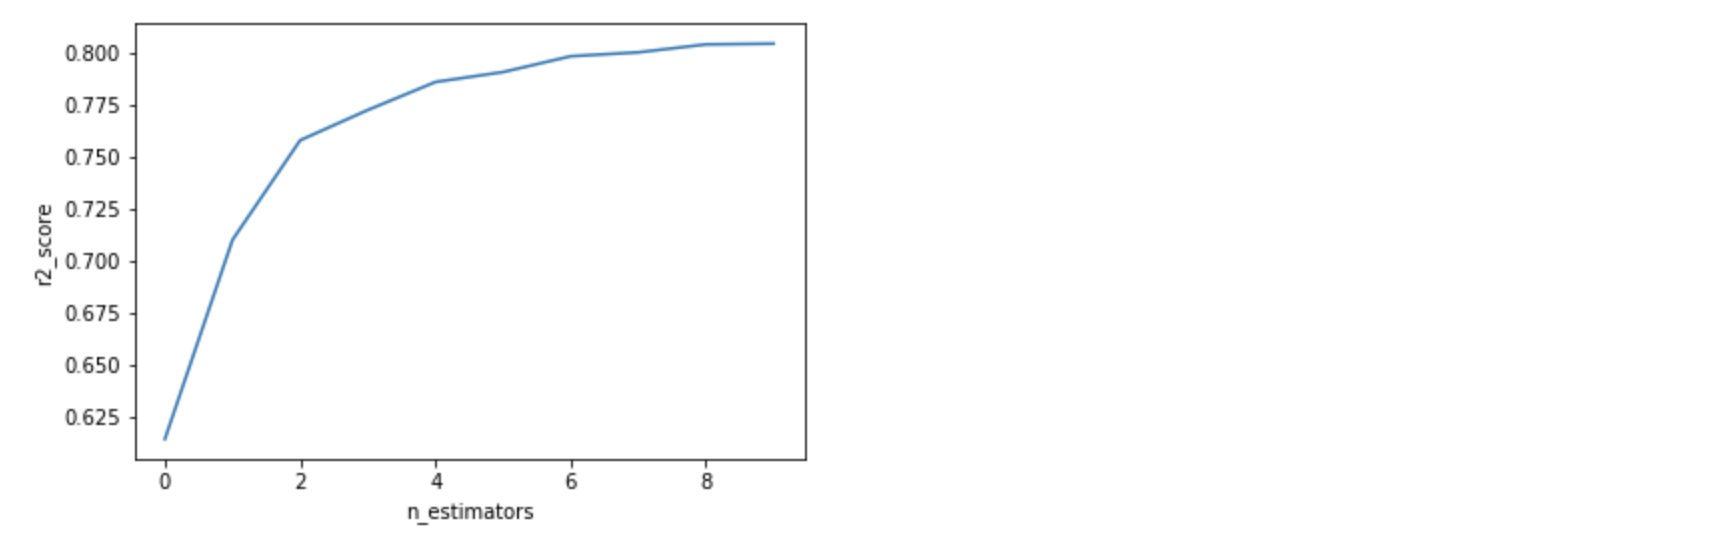
You will get a certain number where your score doesn’t get better, It good to stop there and experiment with other parameters.
Tip 4: What if new trees as not growing as good as old ones:
If your validation score is worse than training score their is a better way to check it rather than checking on validation data.
While implementing a random forest tree each tree uses only ceratin amount of data randomly to form a tree later we can use the remaining data to check if our model overfits or not this method by setting oob_score parameter to True in the model .
1
2
3
4
m = RandomForestClassifier(n_estimators=40, n_jobs=-1, oob_score=True)
m.fit(x_train, y_train)
print_score(m)
# [0.0, 0.18257418583505536, 1.0, 0.9666666666666667, 0.95]
Here the oob_score is 0.95 while train_score is 0.1 while tells that data didn’t overfit that much.
Tip 5: Get the satellite veiw of your forest:
Its always a good way to visualize your forest model for better optimization, Todo that always use less estimators may be 1
1
2
3
4
5
6
7
8
9
m = RandomForestClassifier(n_estimators=1, max_depth=3, bootstrap=False, n_jobs=-1)
m.fit(x_train, y_train)
print_score(m)

# Give representative Columns to your data.
x_train = pd.DataFrame(x_train, columns = ['sepal length', 'sepal width', 'petal length', 'petal width'])

# Draw_tree function in fastai let's you visualize the tree
draw_tree(m.estimators_[0], x_train, precision=3)
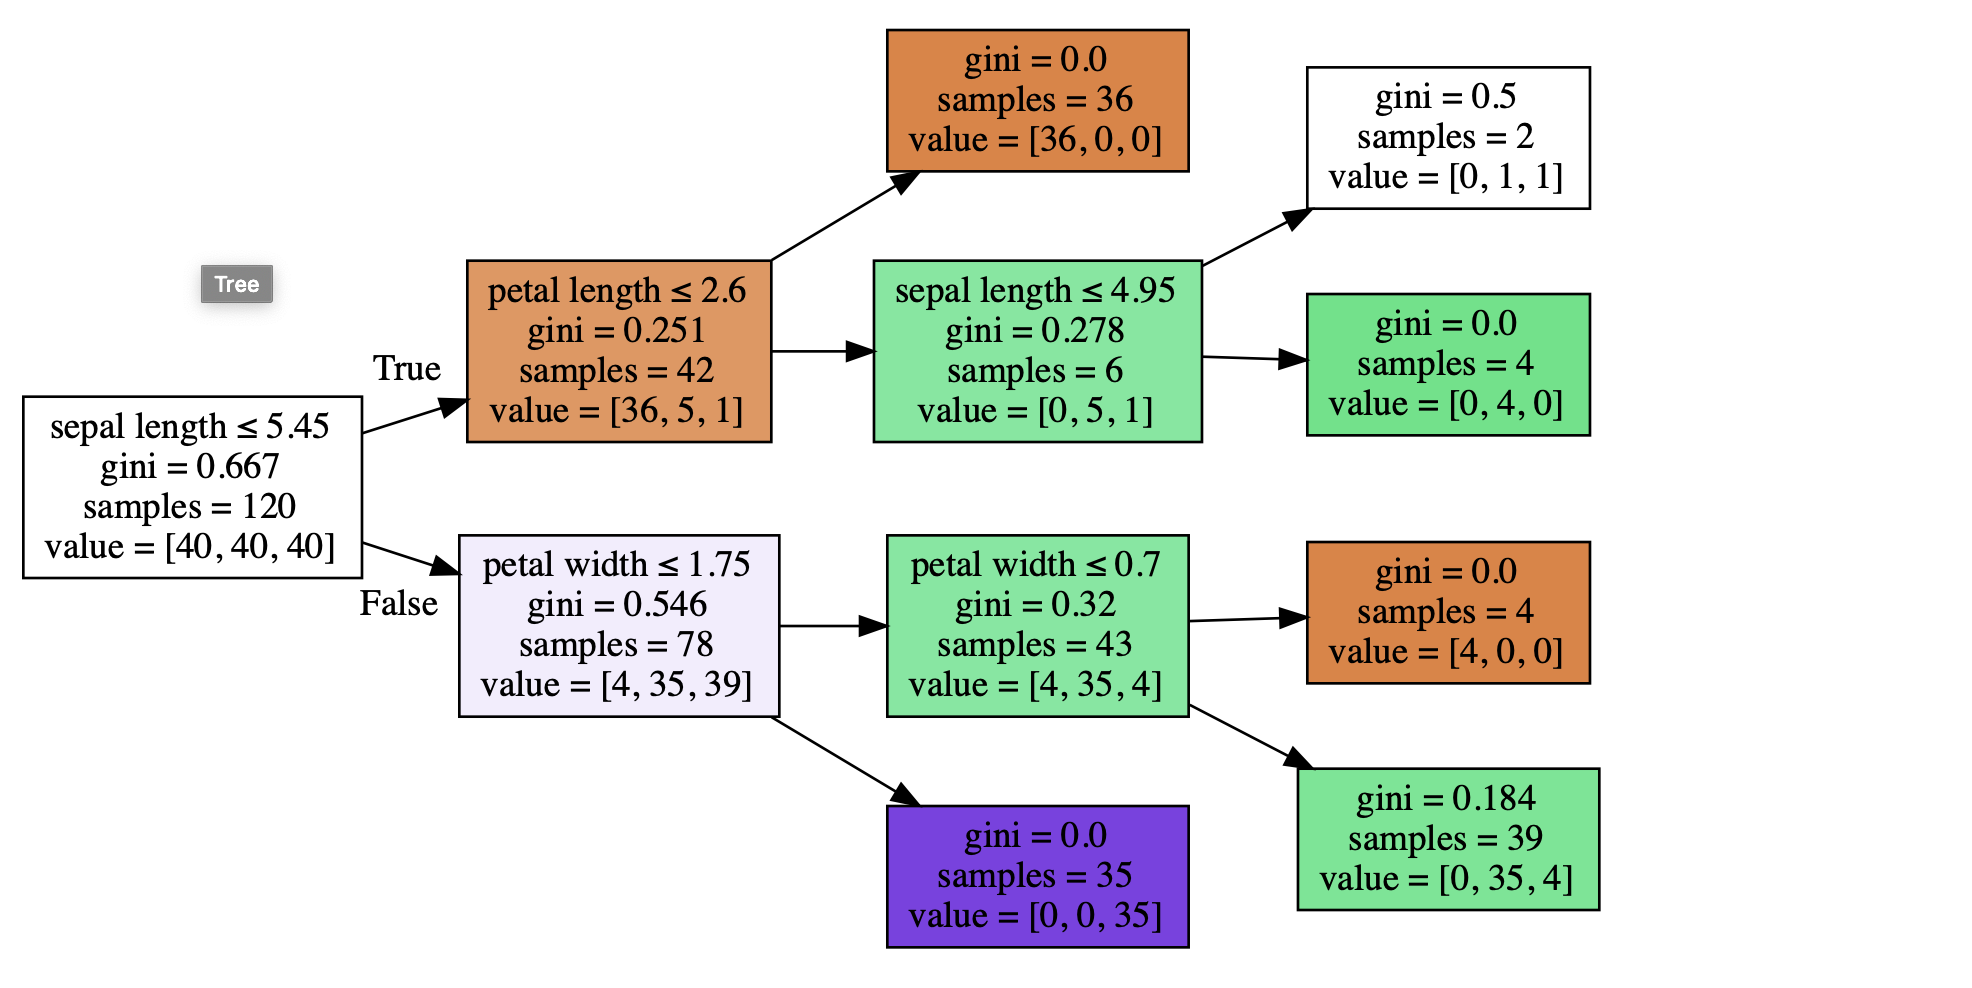
We can observe here that sepal length plays an important role in differentiating the data
gini : represents the error score if you classify data with that particular set of labels until then.
samples : No:of samples in that group
value : mean value of each class
Tip 6: Less Branches makes the tree grow Tall
Inorder to acheive this we will use:
min_samples_leaf : This will limit the number of leaf nodes in a tree which intern reduces overfitting and therefore predictions are made using more number of estimators reducing volatility of the model.
max_features : Along with randomizing the data row-wise for each tree max_features limits the number of features for each tree ,which randomizes the model further and reduces bias.
-
Previous
Design your First Custom Neural Network from scratch Using PyTorch -
Next
Basic Machine Learning Pipeline